In my last post, I wrote this about nitrogen:
“..it is the crux of everything we do in turf management.”
Of course there are numerous cultural inputs important to the quality of a putting surface, but to me it is nitrogen that holds the key. If one wanted to go an entire golf season with no topdressing, no verti-cutting, and no aerification of any kind (exactly what we did last season), the careful consideration of nitrogen is going to hold the key.
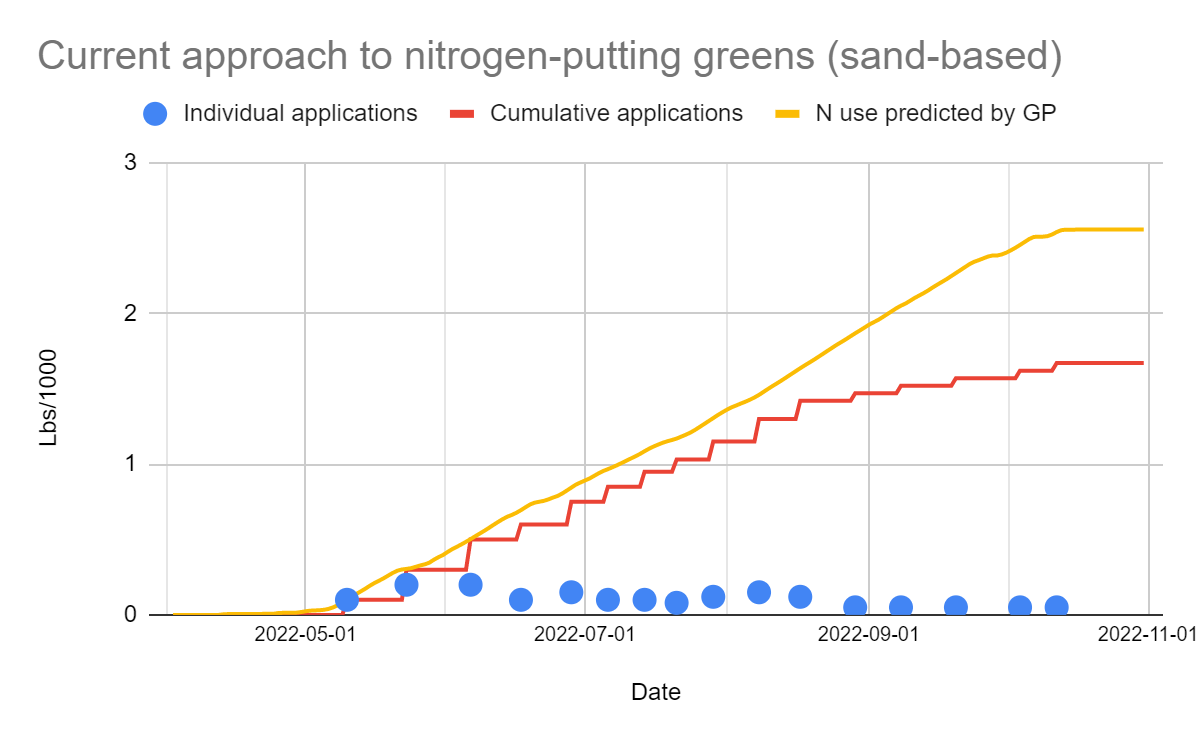
If you haven’t read the last post, or need a reminder, chart 1 offers a visual of 2022’s putting surface nitrogen applications. One question I received after the last post was:
Am I right in looking at your chart that you are applying N at similar rates but altering the frequency of application in relation to the gp? If so, what is your signal to reapply eg, yield removed, or do you just shift to a weekly interval?
It’s a question I’ll attempt to answer in this post.
The timing of our putting surface applications is determined by the re-application of plant growth regulators (PGRs). PGR timing is determined using the GDD models available in the Greenkeeper app. In my own spreadsheet, I keep track of some of the daily, location specific data Greenkeeper gives us.
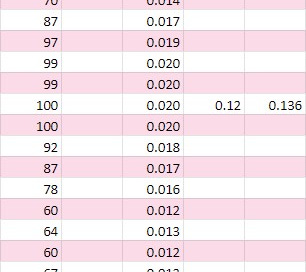
Table A shows the data I use to determine the amount of N in each application. The top row of this chart is 14 July, 2022. The bottom row 8 August. Each day, I record the GP (left column) from Greenkeeper.1 A formula populates the third column. The formula assumes that with 100% GP, the plant would use 0.02 lbs/1000 of N. The column on the right totals the N predicted by GP since the last application. The second column from the right is the amount I applied on that particular day. In this 26 day period, we made four putting surface applications and I applied 88% of the N the GP model predicts would’ve been used by the plant. This period can be spotted in chart 1.
Table B begins with the next application made, which came on 17 August. This chart shows the same data for a 23 day period ending 8 September. The weather during this period was cooler, which means the GP is generally higher and the re-application intervals for PGRs longer. Hence only three applications during this period.
During the period of Table B, it was also becoming apparent to me that we were maybe growing a little bit too much grass. Our clipping volume was up a little bit and the surface of the green was what I would call a little bit “scuffy”, meaning by the end of the day, the foot traffic was leaving more scuffing on the greens than I would’ve hoped for. In such a case, I think it would be typical for a turf manager to want to perform some kind of surface disruption to deal with the problem. Surface disruption is something hated by both myself and our golfers, thus I was looking to avoid any such practice. My plan to deal with this scuffiness was to reduce the nitrogen. I suspected this would lean the plants out over the next few weeks, which proved to be the case.
My reduction of N started with the application of 0.125, against a predicted use since the last app of 0.177. The next two apps would reduce further with 0.05 lbs/1000 becoming the de facto amount on any app the rest of the season. This reduction can be visualized by the red line on chart 1, which flattens and drops away from the gold line representing the predicted N use.
GP is expressed as number from 0 (no growth), to 100 (maximum growth)


Hi Chris, thank you very much for sharing all this great information!! Chris, is the nitrogen source also important?
Thanks
Hi Chris, very interesting but I wonder why you estimate growth using growth potential and then also measure actual growth using clip vol. ?! Clip vol alone should be sufficient?