
2017 vs. 2023
First year of data collection vs. this year

I’m always sort of passively looking for something to write about. The ideas come from all kinds of directions: seeing, hearing, or remembering something are all ways in which ideas come to me.
During my recent speaking engagements, I was often asked, "What changes have you made since you started collecting this data?” The 2017 golf season was when my data collection adventure started. I started by measuring and tracking our clipping volume; simultaneously, I was beginning to think that our management of putting surfaces was too disruptive to our membership, and I wanted to try to reduce disruption.
Specific to how we were managing putting surfaces, disruption meant topdressing. I knew the crux of disruption reduction was nitrogen; if we could grow less grass, less topdressing would be required.
My recent writing idea was to compare 2017 and the beginning of my data collection adventure with 2023, a year in which my use of data-based decision-making has become rather sophisticated.
Below, I offer a comparison of the two seasons. Note: I only measured clipping volume and nitrogen applications in 2017, so topdressing is estimated using photographic evidence.
2017
· Nitrogen applied-1.02 lbs/1000ft2.
· Total Clipvol=1,797 ml/m21
· PGRs were not used.
· DryJect on May 18th. Est of 1.75mm sand applied.
· Topdressed and deep-tined on Aug 1st. Est of 1mm sand applied.
· Heavy topdressing before winter on Nov 13th. Est of 2mm sand applied.
· Total topdressing applied: 4.75-5mm
2023
· Nitrogen applied-0.78 lbs/1000ft2.
· Total Clipvol=1,181 ml/m22
· PGRs were used.
· ½” solid-tine, backfilled with sand on Aug 1st. 1.7mm of sand was applied.
· Medium topdressing before winter on Nov 15th. Measured 1.5mm sand applied.
· Total topdressing applied: 3.2mm
The charts below help to visualize the differences in nitrogen applied and clipvol measured.


What becomes very evident in these charts is that when more nitrogen is applied, more clippings are harvested. While included in the table above, it is worth noting again that I did not apply PGRs to putting surfaces in 2017 but did so in 2023.
The cynic may say: “Wow, this all looks pretty similar; why bother collecting all the data?” Two points are worth making:
1. I don’t have Greenspeed data from 2017, like for 2023. I guess the speeds in 2017 were not as consistent or as high as in 2023. I can’t quantify the consistency, but I would think it was not nearly as good in 2017 as in 2023.
2. The visual quality in 2017 needed to be improved and was a source of negative feedback from the golfers.
Finally, I include photos of the putting surfaces from 2017 and 2023. The improvement in visual quality is evident.
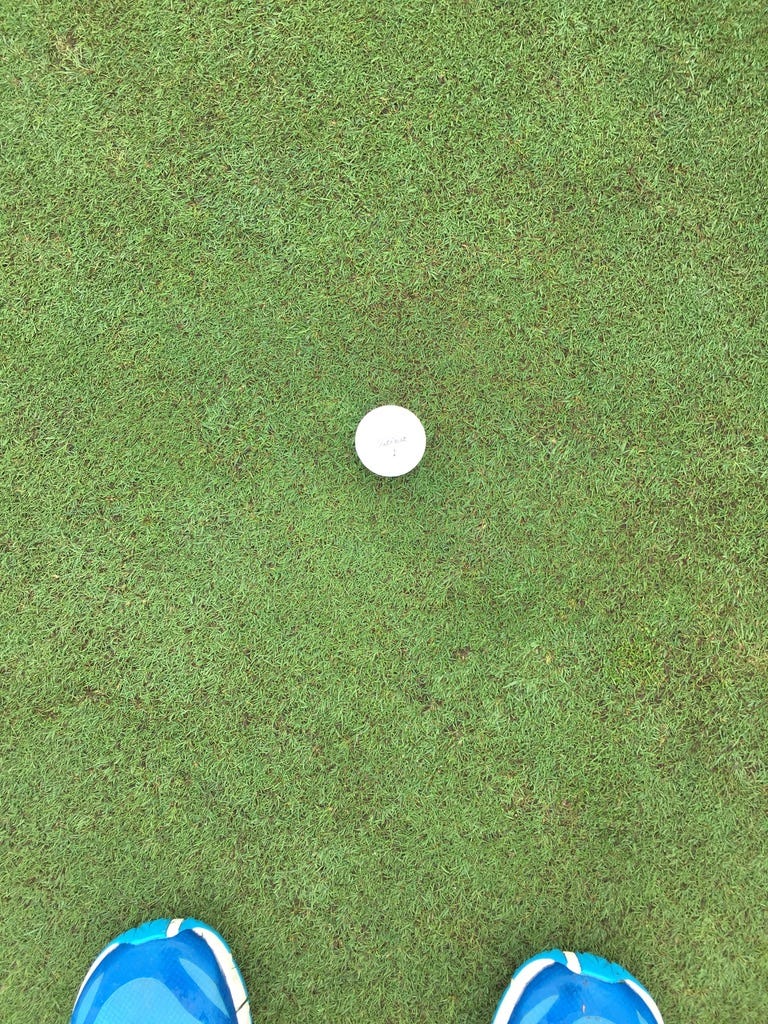
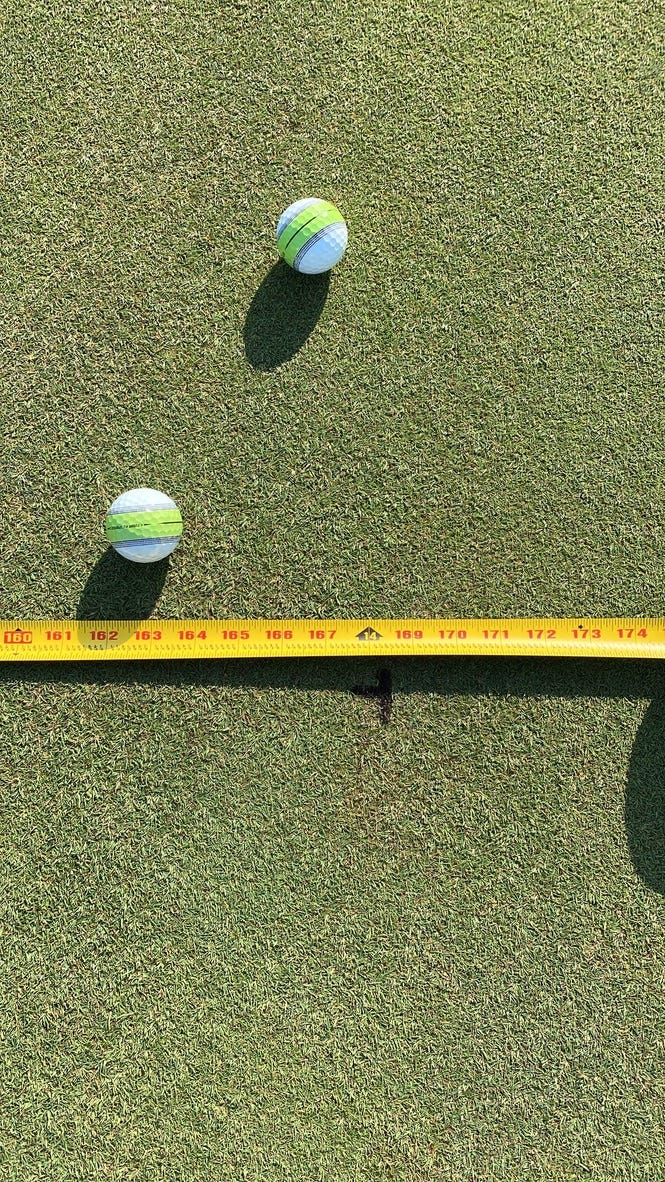
Summing up the difference between 2017 and 2023, data collection and analysis have allowed us to achieve better quality and consistency while doing less. Ultimately, we should all aim to provide the highest level of quality, using the least resources.
Accumulated total of the daily average of all greens.
Also, the accumulated total of the daily average of all greens.
Hey Chris, I listened to your USGA podcast and thought it was a great summary of what you are learning! Thanks.